For tens of thousands of years, humans have observed the minute seasonal changes that make or break a harvest. Now, for the first time, satellites have caught up. A study published this week in Nature used cutting-edge satellite methods to map the fine detail of seasons around the world.
Studying plants from space
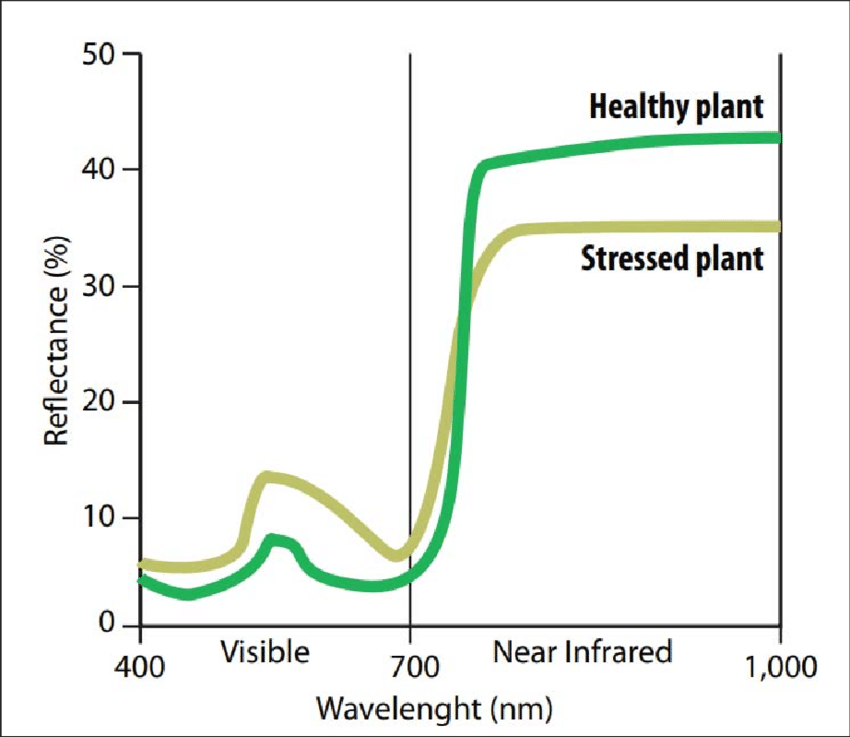
The near-infrared reflectance of plants can be used to probe their stress. Photo: Van Niekerk et al 2019
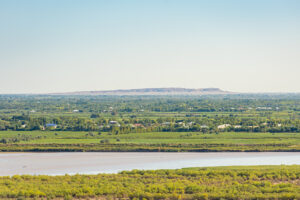
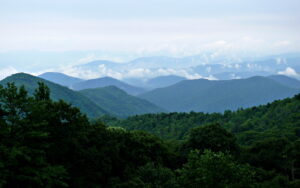
The simplest approach to studying seasons across the whole planet is to image the Earth from space and track green vegetation. In winter, for instance, the top half of North America sits gray and dismal. Green rushes up from the lush forests of the south, bringing spring rain and blooming flowers. Trees burst back into life. Then, as fall creeps in, a fire-red line sweeps south and once more leaves grayness in its wake.
This is the traditional method of remote sensing phenology, or the study of the seasons from satellites. But while green shows the ebb and flow of summer across much of inland North America, Europe, and North Africa, it starts to falter in arid regions and the tropics. How can you track seasonal changes across the Amazon or the South Pacific, where the leaves are always green?
Plant stress
This new study tracks seasons by how much plants are growing in a particular region. To do so, it applies techniques common in agriculture and ecology. When plants convert sunlight to energy, the chemical mechanisms in photosynthesis release red light at two very specific frequencies. This phenomenon, known as solar-induced chlorophyll fluorescence, helps farmers identify how stressed their plants are. Stressed plants do not photosynthesize as efficiently as happy ones. The new study uses plant stress to track seasonal changes across regions that don’t have more obvious markers of summer or winter.
They also use near-infrared observations of plants’ reflectivity, or how much sunlight they absorb versus what they reflect. When plants are thriving, they reflect a lot more near-infrared light than when they are stilted and slow-growing. This method, coupled with solar-induced chlorophyll fluorescence, offers a window into vegetation health even for evergreen plants.
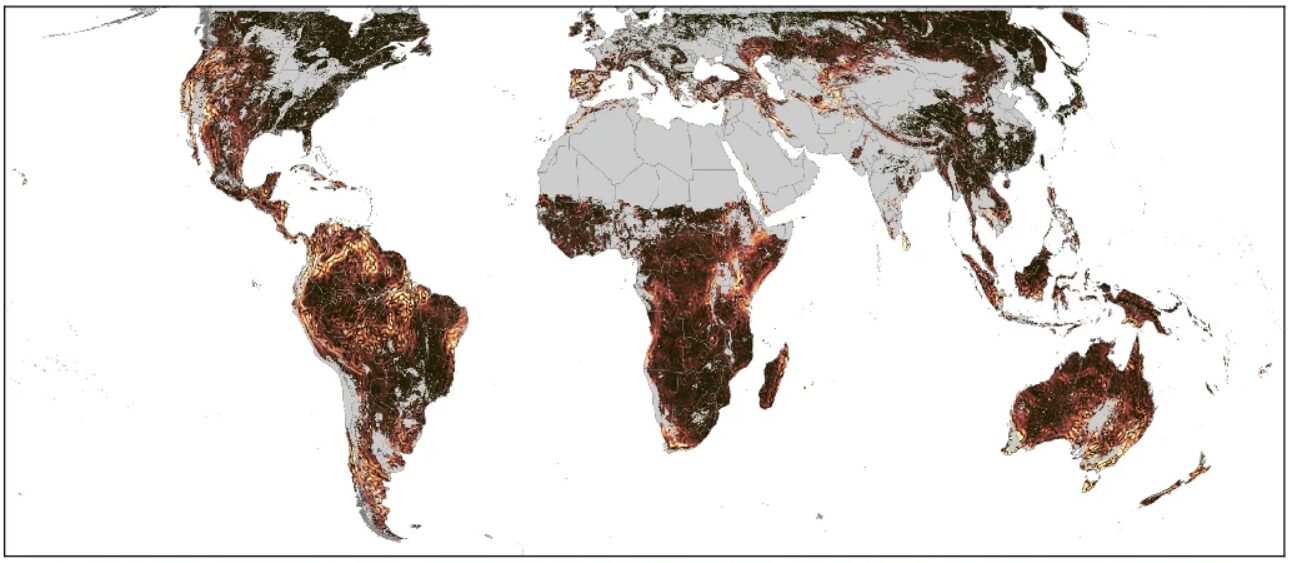
Dark green in this temporal map shows regions of peak vegetation growth. North Africa and Antarctica are not included in the dataset. Photo: Terasaki Hart et al, 2025
A changing seasonal map
The team found that more factors predict seasons than simply the north-south dichotomy over what time of year is summer. Some regions, such as Amazon floodplains, don’t have two distinct seasonal changes in the year. Instead, one major event — such as a yearly flood — dominates vegetation change.
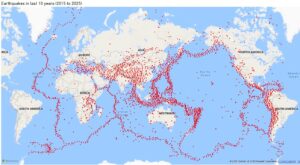
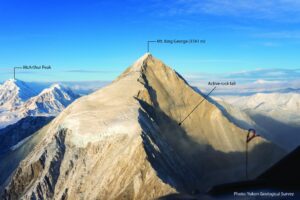
Another curious outcome of the study is that despite what intuition might suggest, nearby regions with similar climates don’t necessarily sync up their seasons. These regions of asynchronicity often pop up near mountain ranges. Mountains can dramatically alter airflow and weather patterns, creating micro-weather systems and thereby disconnecting regions as nearby as a few dozen kilometers. In an article for ScienceAlert, lead author Drew Terasaki Hart gave the example of Phoenix and Tucson, Arizona. Tucson experiences summer monsoons while the residents of nearby Phoenix bake in 50°C heat.
The effects of this seasonal mismatch
The team’s research provides additional evidence for the hypothesis that posits high local seasonal variability increases biodiversity. If a species lives in both Tucson and Phoenix, the hypothesis runs, then the arrival of rain might cue mating at different times. Over the long term, this could result in the species splitting into two separate species.
While this hypothesis is far from accepted, the new study’s findings do support it. For instance, the hypothesis predicts that tropical regions should see more local variability in seasons since they have higher biodiversity. This is exactly what the new study found.
If you’re interested in exploring your local micro-climate through the eyes of plants, check out the team’s interactive map here.